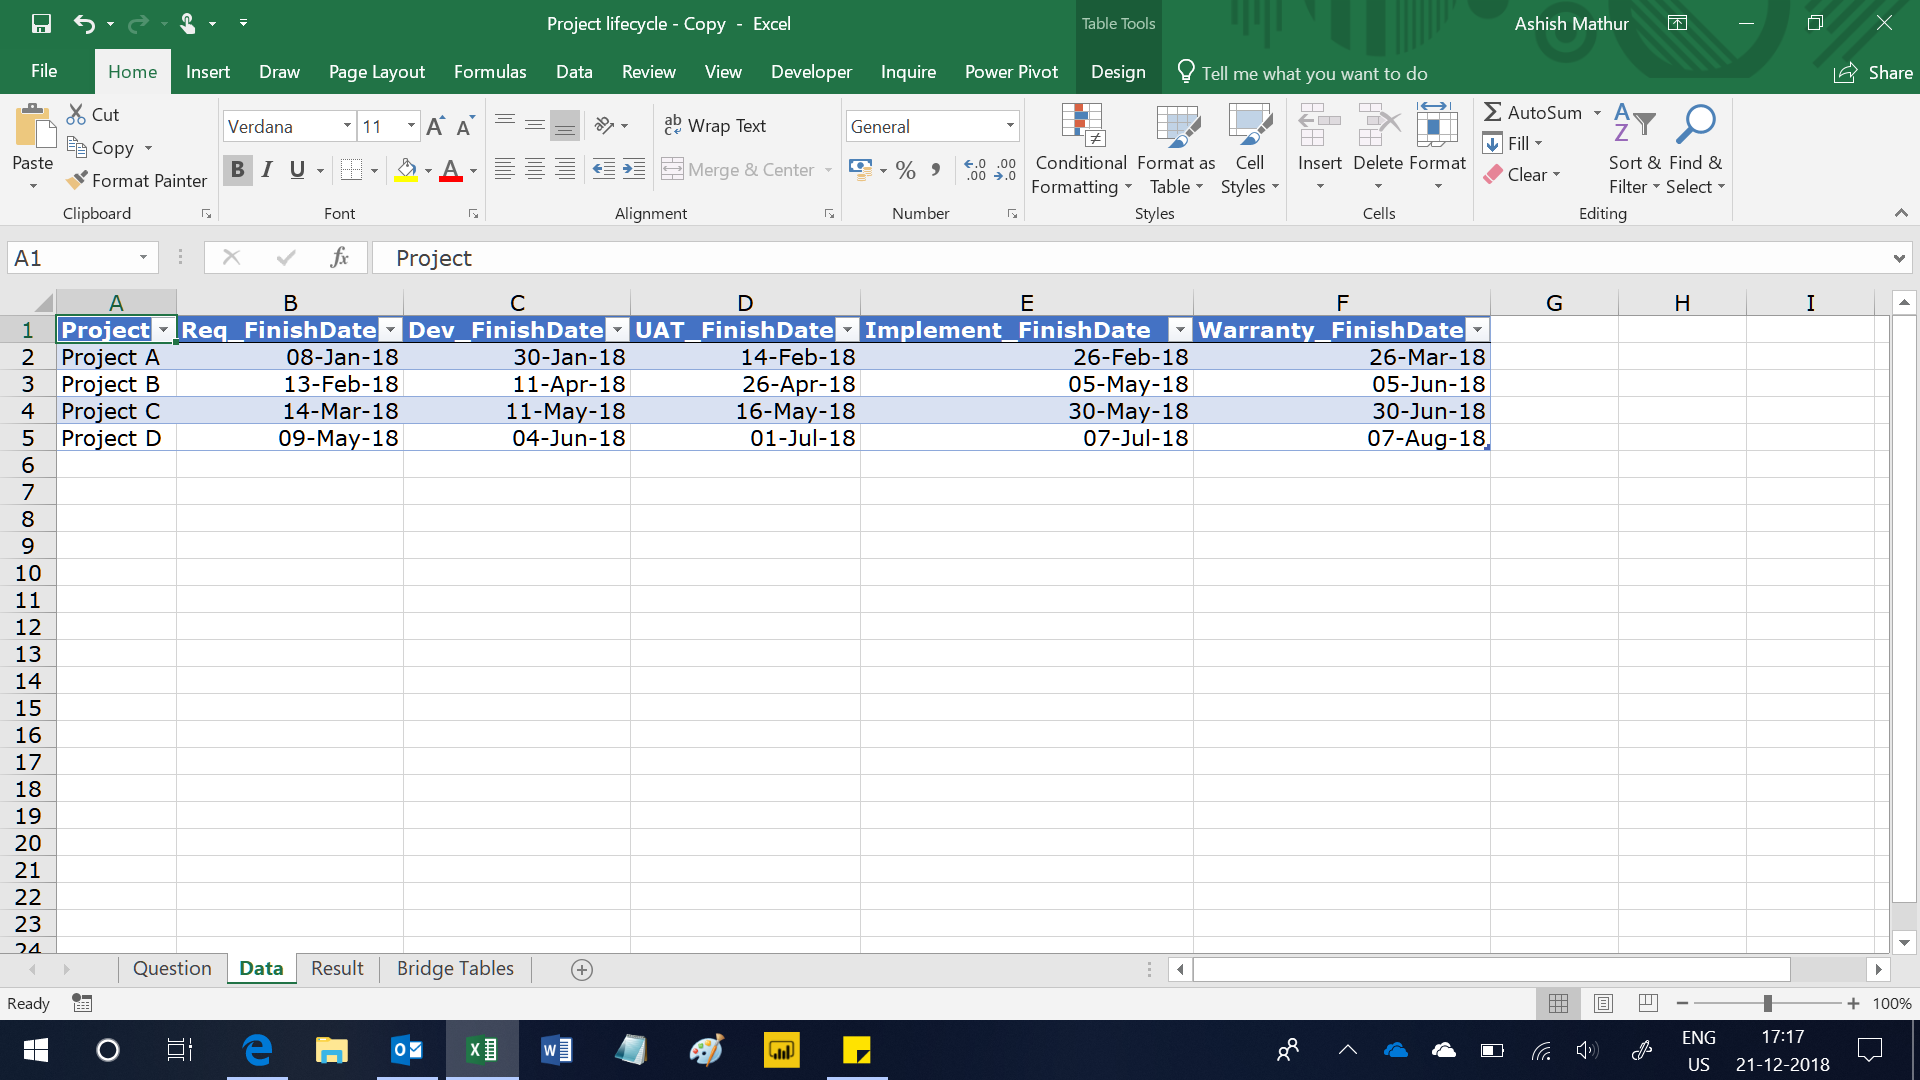
Visualise a simple 6 column Table as shown below – Project Name and the finish date for each of the 5 stages that the projects go through. Each project goes through 5 stages – Requirement (Req), Development (Dev), UAT, Implement and Warranty.
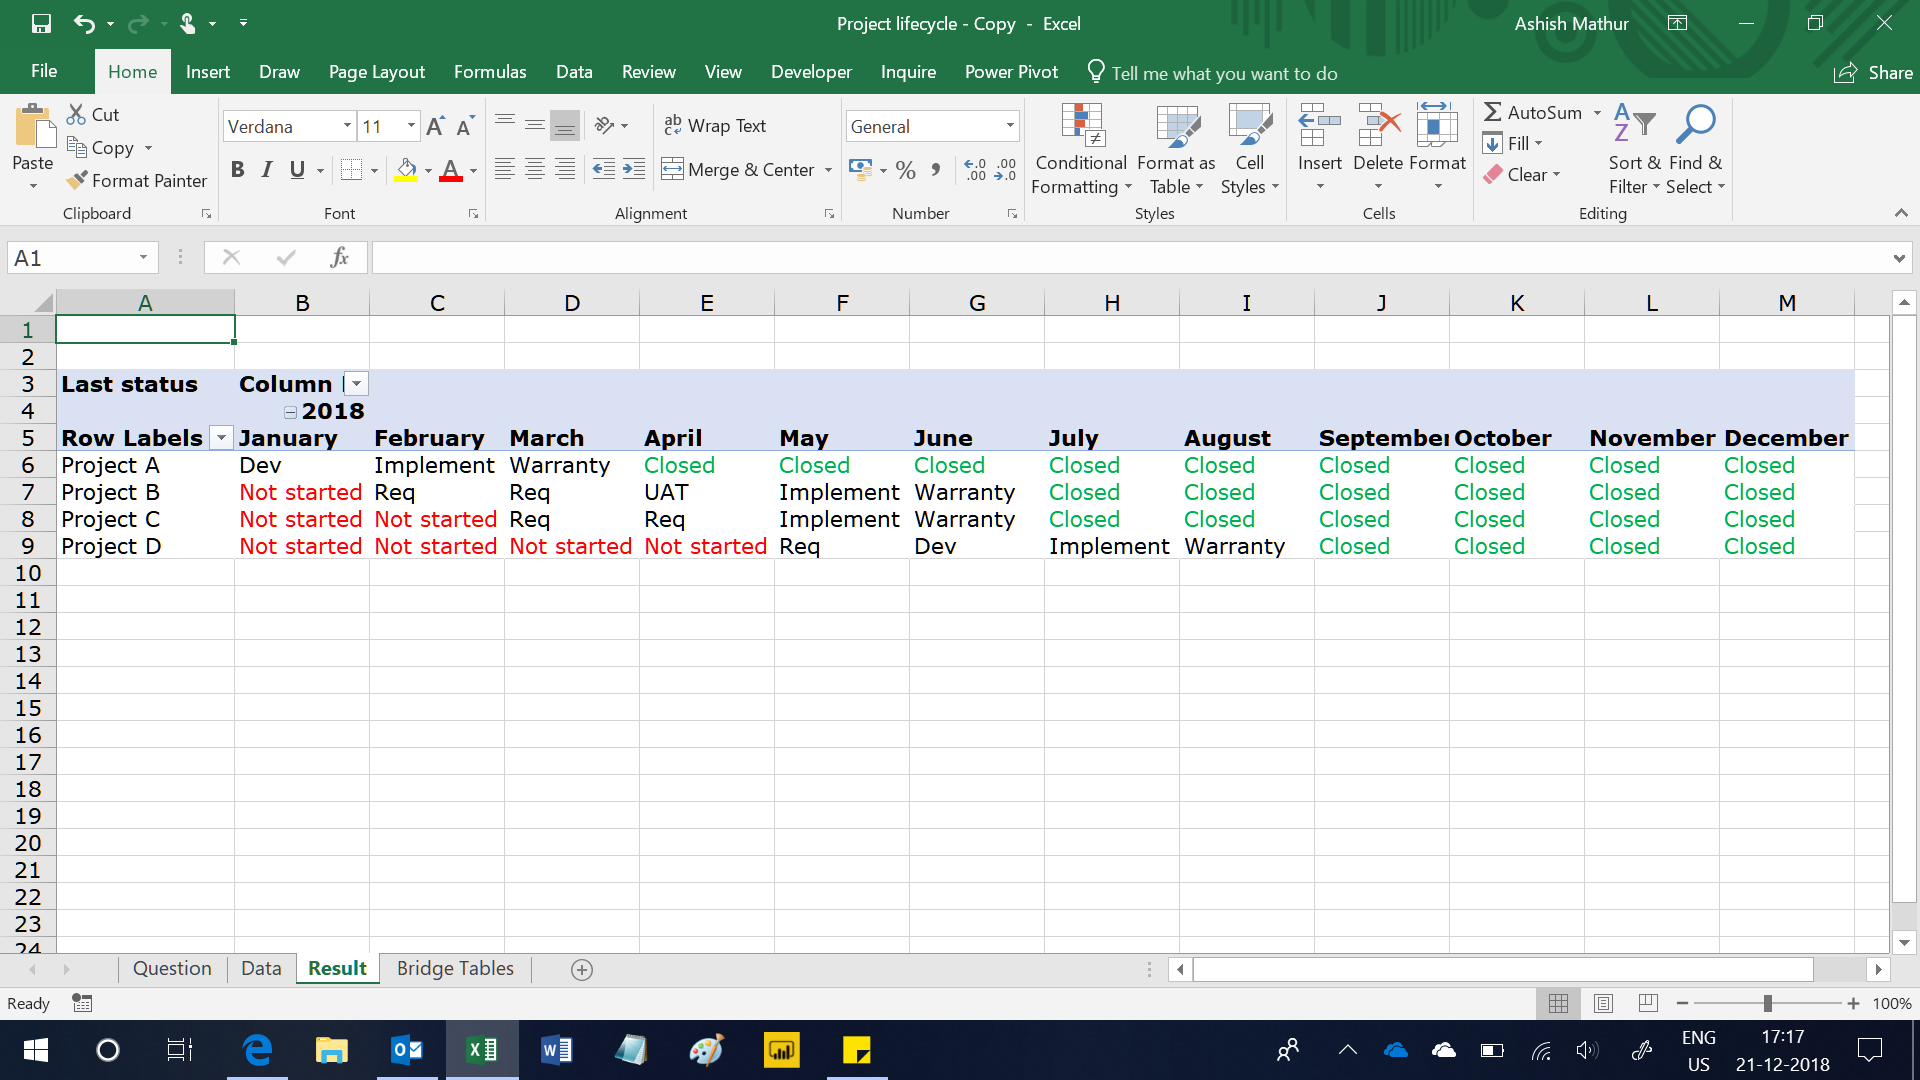
The objective is to report on the status of each project at the end of each month based on which stage is/was completed in that month. So, if a given project’s requirements are completed in January and development completes some time in March, the one would expect the output of the report to show the project’s status in January and February as “Req” and in March as “Dev” respectively. February should also show “Req” because the next stage was completed only in March (although it may have started in January). If multiple stages complete in one month, then the report should display only the most recently completed stage. So, if Project A completed both Requirements and Development stages in January, the report should show only “Dev” as the stage completed in January.
For the data shared above, the expected result is:
You may download my solution workbook from here.
Show Project wise status in a Pivot Table
{ 0 Comments }