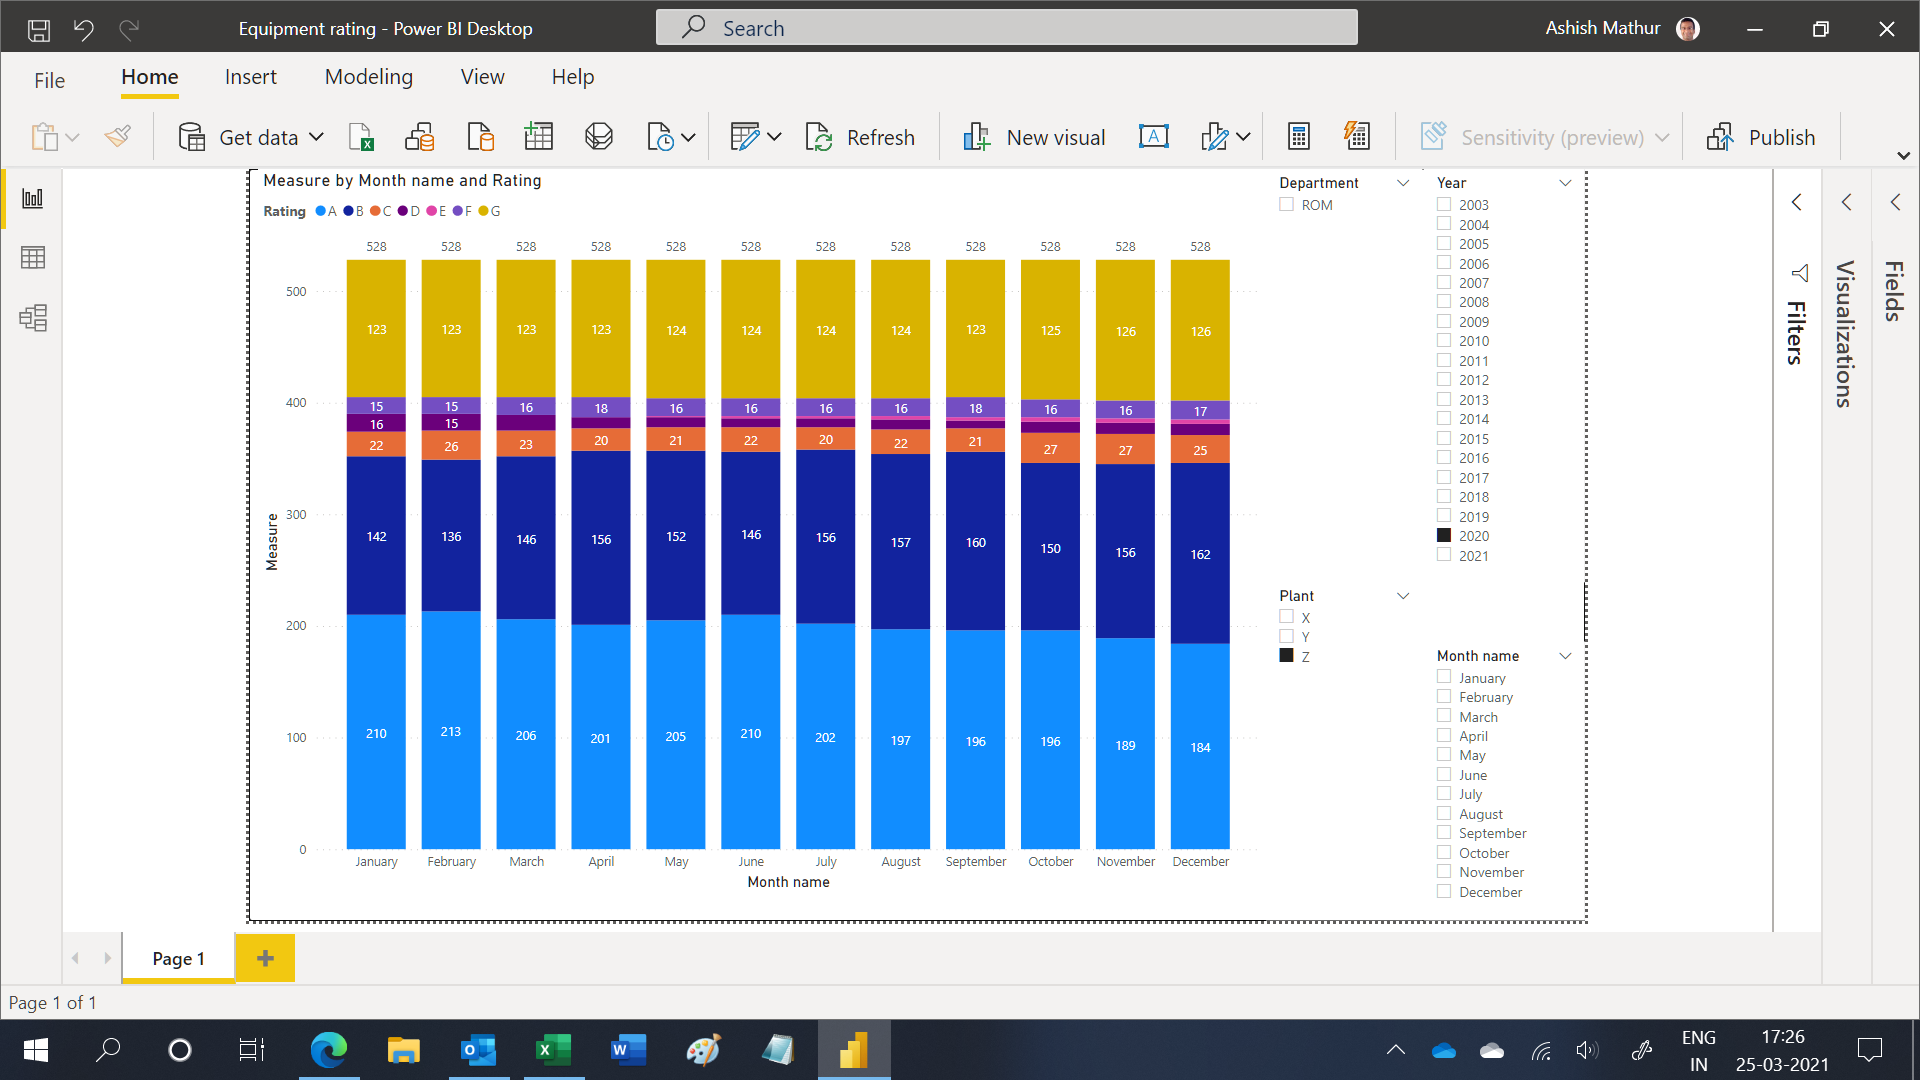
There are 100 machines in a factory. Every machine has different test frequency. In a given month, not every machine is tested but we still have the last known rating (from some previous month) of that machine. We have to show the latest rating of each machine for each month in a stacked column chart. This way, the total number will remain 100 every month in the chart, but the rating distribution (color based on legend) will change based on last available rating of that machine.
For example, in January, 35 machines were tested. So we have latest ratings of these 35 machines. But as the rest of the machines also have some previous rating, the graph needs to show all 100, with last available rating.
The expected result should look like this
You may download my PBI Desktop file from here. The very same DAX formulas can be written in the DAX formula language of MS Excel as well.
1 Trackback