This post is an extension to the one I posted here – Segment towns according to volume contribution and market share. Here’s a simple dataset of Shampoo sales in the state of Rajasthan, India.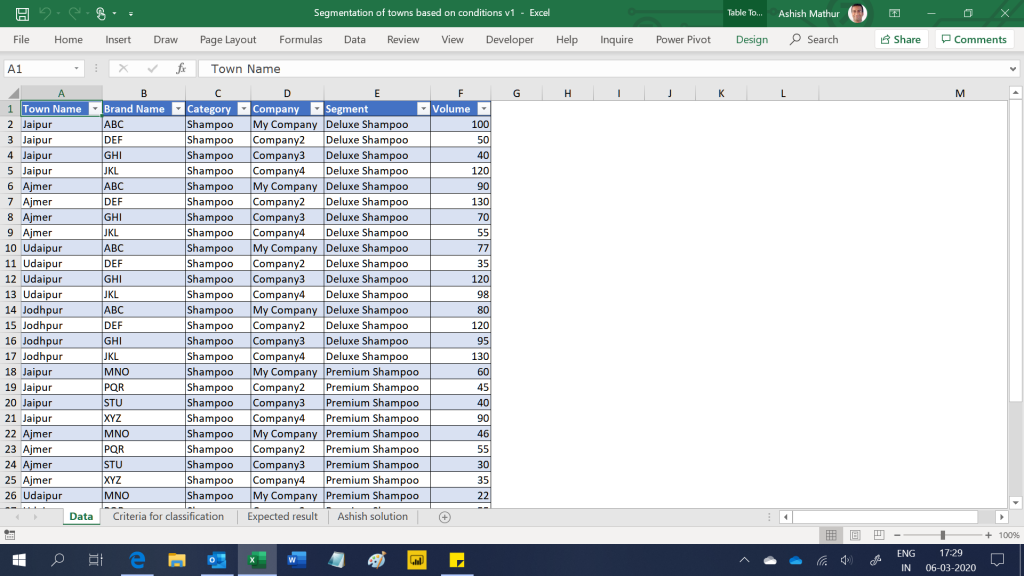
For a chosen segment, one may want to segment the 4 towns based on the following conditions: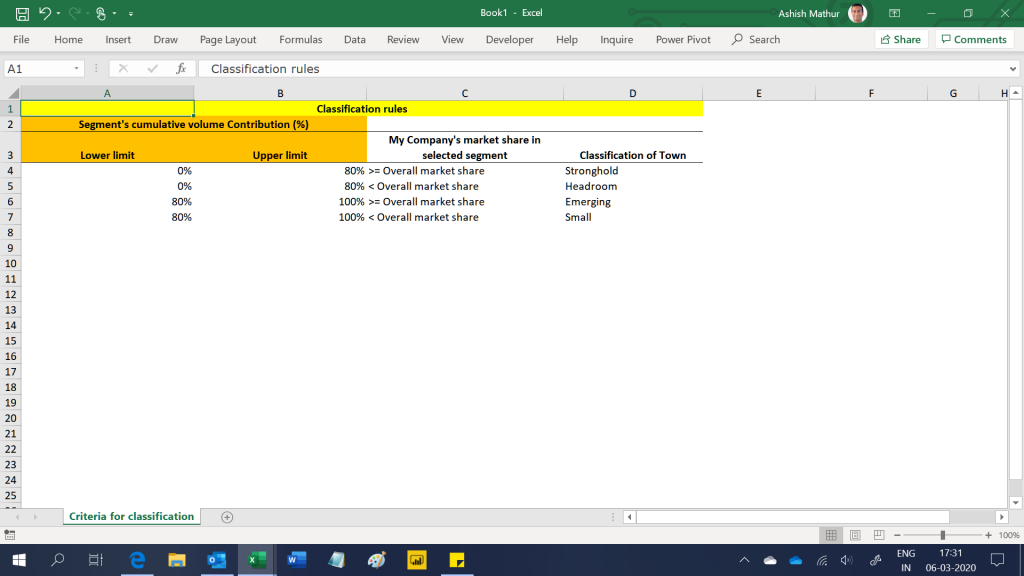
Based on the two screenshots shared above, the desired result is shown in the screenshot below: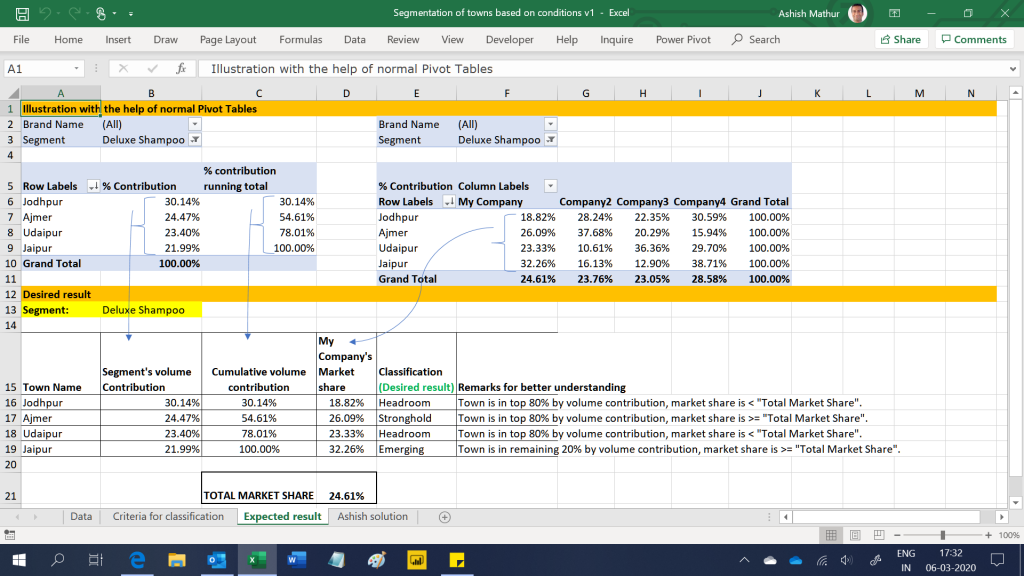
The difference between this solution at the previous one (the link of which I have shared above) is that in this one we want to drag the Classification (range E16:E17) to either the row/column/report filter section of the Pivot Table use it as a slicer. The current limitation with measures that one writes in PowerPivot’s is that measures cannot be used in either row/column/report filter section or as a slicer of/in a Pivot Table. So in the previous solution, I had written a measure to return the result as Headroom, Stronghold, Emerging or small in only the value area section of the Pivot Table. One could not drag that measure into the row labels of a Pivot Table. In this solution, one can drag the Town classification to the row/column/report filter section or even to the slicer (see images below)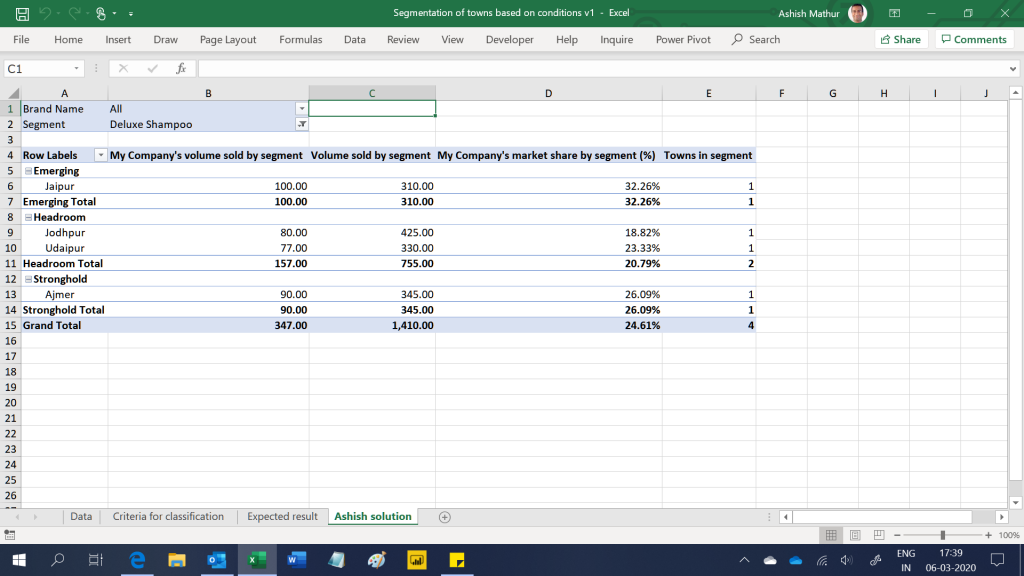
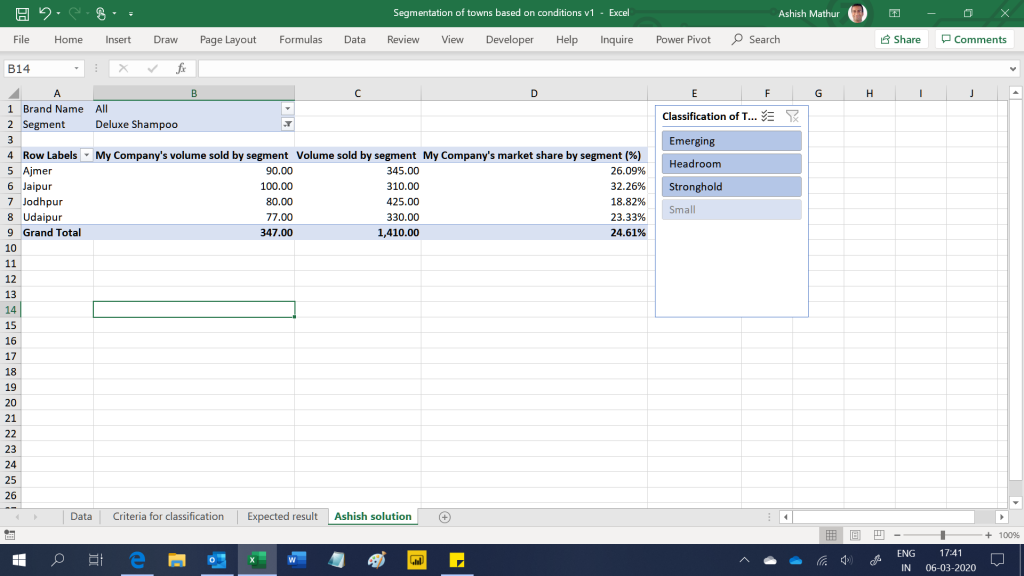
You may download my solution workbook from here.

Segment towns according to volume contribution and market share with a slicer
{ 0 Comments }