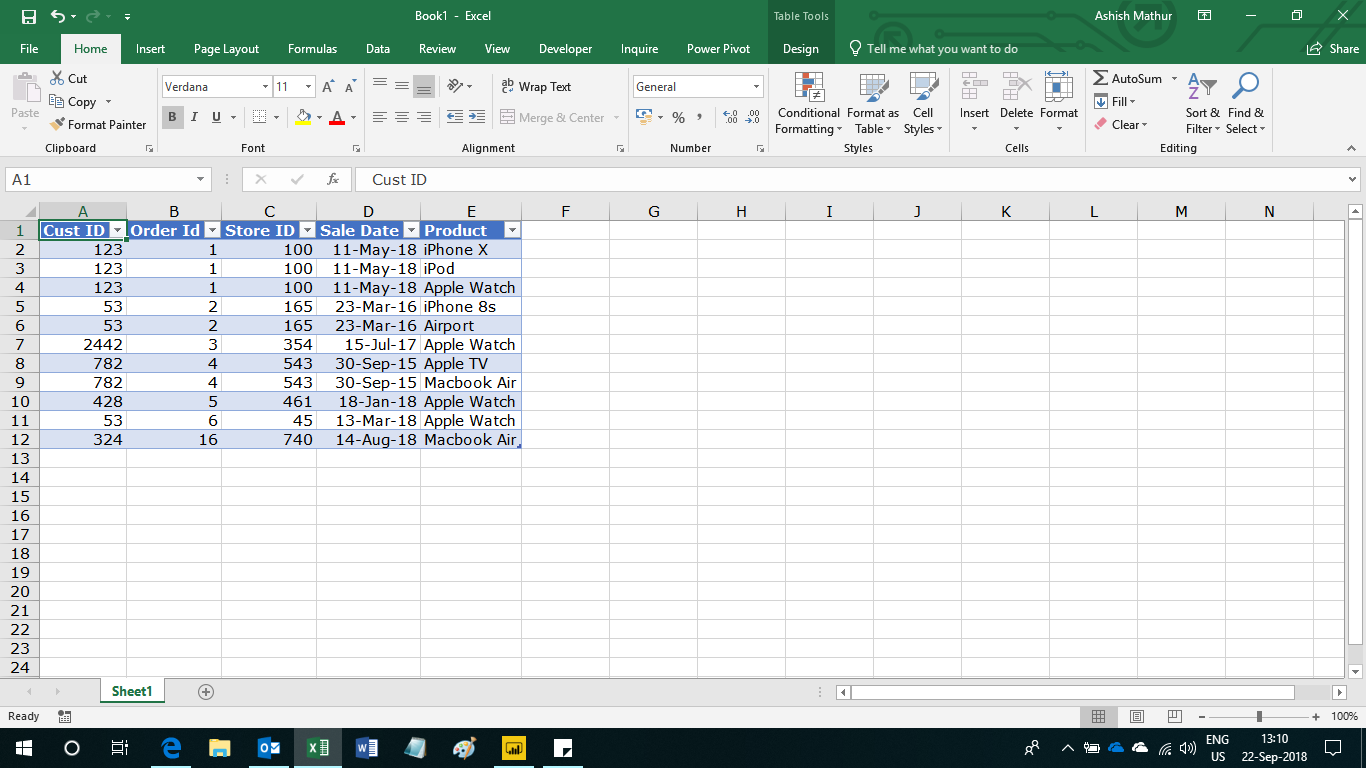
Here’s a simple Sales data of a retail Store which sells Apple Products. Since a customer can transact multiple times, there will be repetitions in the Cust ID column. While Cust ID 123 and 782 purchased multiple products from the same Store in one transaction, Cust ID 53 purchased multiple products from different stores (Store ID 165 and 45) [and therefore the Order ID’s are also different (Order ID 2 and 6)].
On this small sample, one may want to identify “Cross and up selling opportunities” i.e. one may want to know which are the Customers that can be approached for selling more products to. So for e.g. one may want to know which Customers have bought only one product so far. A case in point being the Apple Watch – Customer ID 2442 and 428 bought only this product. The other Customers who bought the Apple Watch also bought atleast one more product. Therefore, Cust ID 2442 and 428 could be approached for buying other products as well.
Solving this via conventional Excel formulas and Pivot Tables would prove to be a formidable challenge. I have solved this problem using a Data visualisation software from Microsoft called PowerBI desktop (it can be downloaded free from the Microsoft website). This problem can also be solved in MS Excel using Power Query and Power Pivot.
There are 3 sections in the image below – Table at the top (First Table), slicers at the right and another Table at the bottom (Second Table).
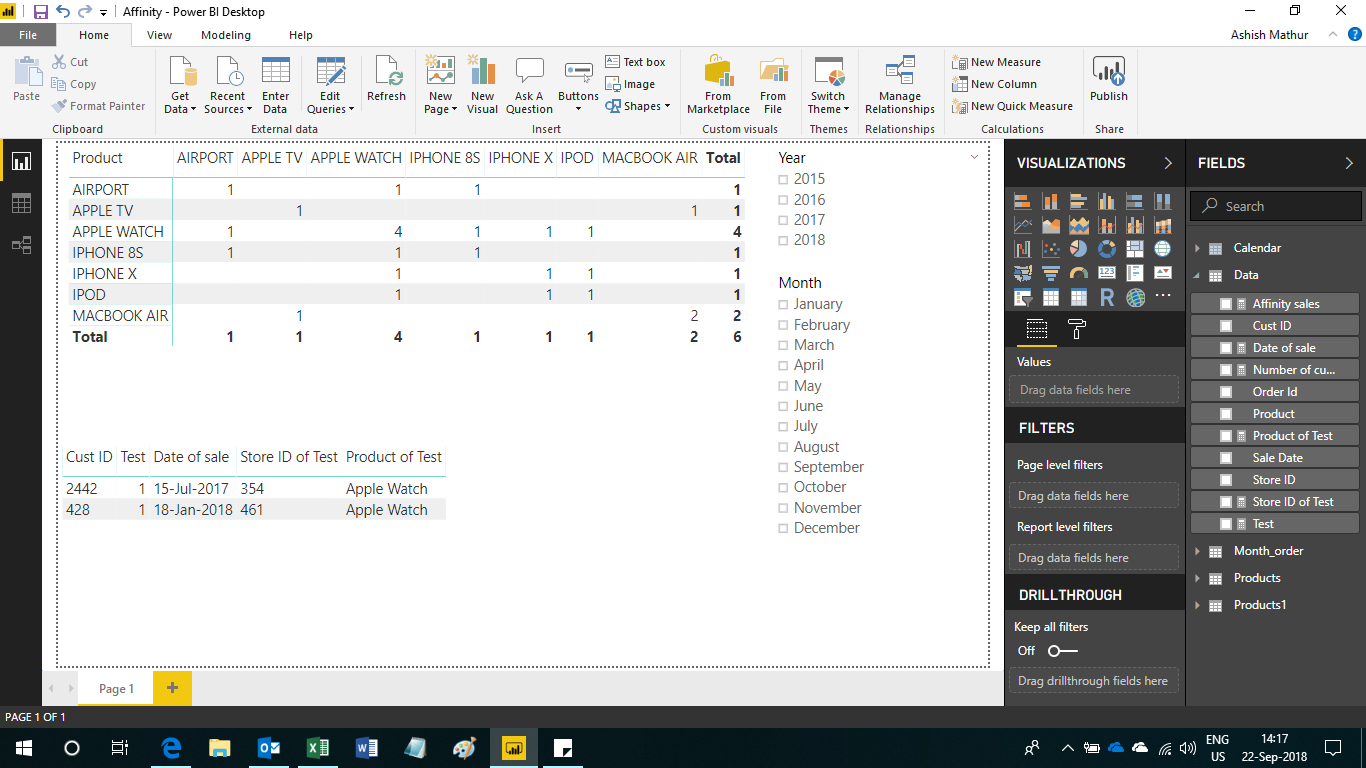
Interpretation of First Table
- 1 appearing at the intersection of APPLE TV (row labels) and APPLE TV (column labels) represents that there is 1 customer who bought the APPLE TV
- 1 appeaing at the intersection of APPLE TV (row labels) and MACBOOK AIR (column labels) represents that the 1 customer who bought the APPLE TV also bought the MACBOOK AIR
- 4 appearing at the intersection of APPLE WATCH (row labels) and APPLE WATCH (column labels) represents that there are 4 customers who bought the APPLE WATCH
- 1 appearing in other columns of the same row represents other products which those customers bought
- When one right click’s on APPLE WATCH and selects “Drill down”, one will be able to see the Customers who bought the other products as well.
- Customer 53 bought the APPLE WATCH, AIRPORT and IPHONE 8S. Customer 123 bought APPLE WATCH, IPHONE X and IPOD
- Customers 2442 and 428 did not buy any other product

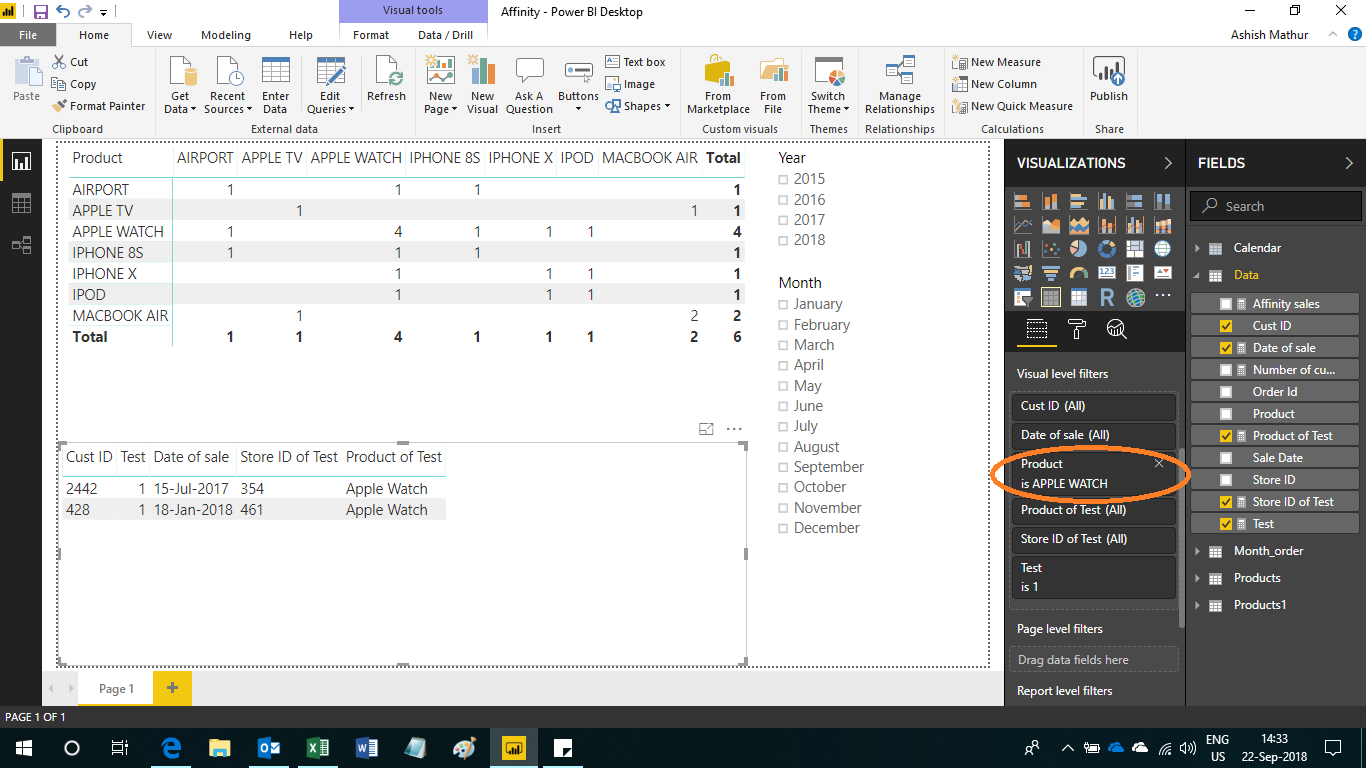
Interpretation of Second Table
This table shows a list of Customers (and their transaction details) who bought only and only that one product selected by the user in the filter section (see the red oval selection in the image). So these two customers could be approached for selling more products to.
You may download my PBI desktop file from here.
Identify Customers that Organisations can upsell or cross sell their products to
{ 0 Comments }