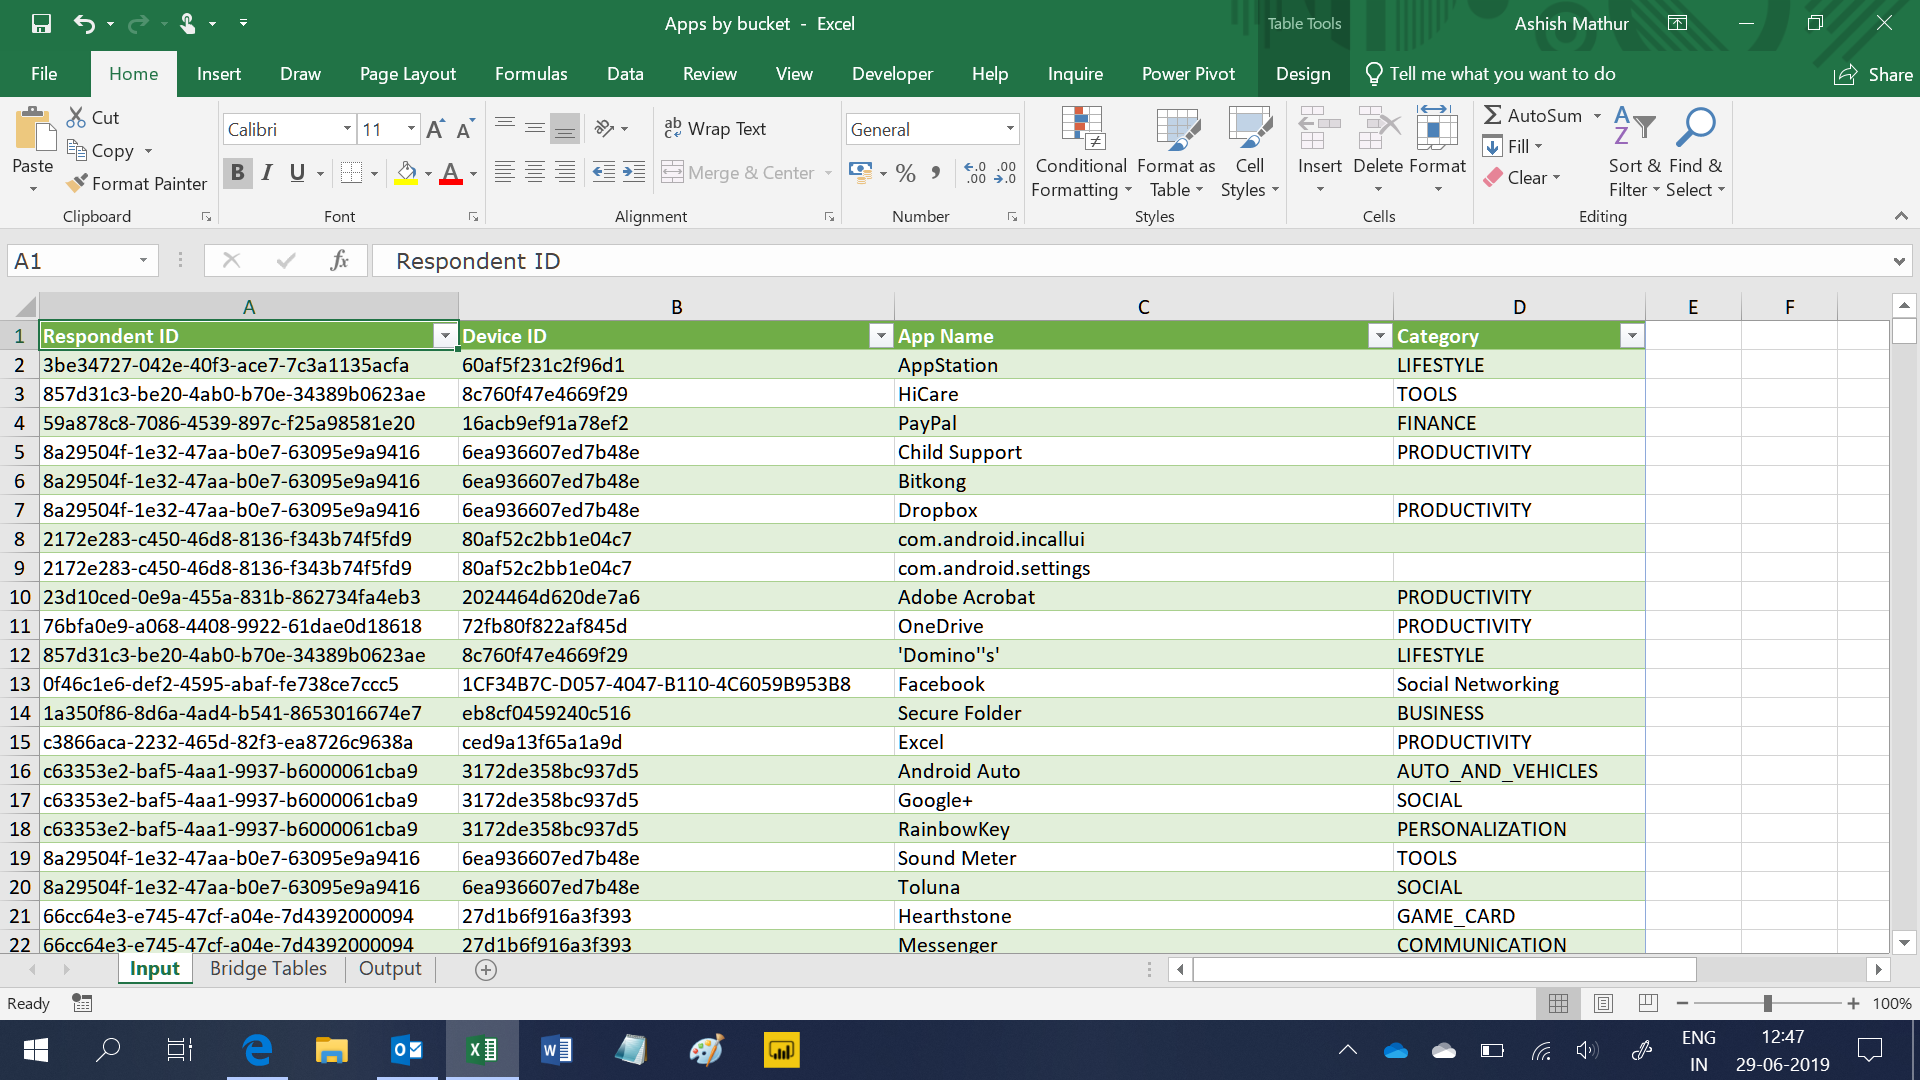
Consider a 4 column table – Respondent ID, Device ID, App Name and Category. So this dataset shows which apps are installed on which device ID by which user and which category do the apps fall into. It is a small dataset with only 4 columns and 2,000 rows.
The question on this dataset is – “I would like to segment the total user base by Categories into the following 9 buckets:
- Those who only have 1 app installed; and
- Those who have 2 apps installed; and
- Those who have 3 apps installed; and
- Those who have 4 apps installed; and
- Those who have 5 apps installed; and
- Those who have 6 apps installed; and
- Those who have 7 apps installed; and
- Those who have 8 – 10 apps installed; and
- Those who have 10+ apps installed
The expected result is a Pivot Table with buckets in the column labels, Categories in the row labels and number of people in the value area section (as shown below)
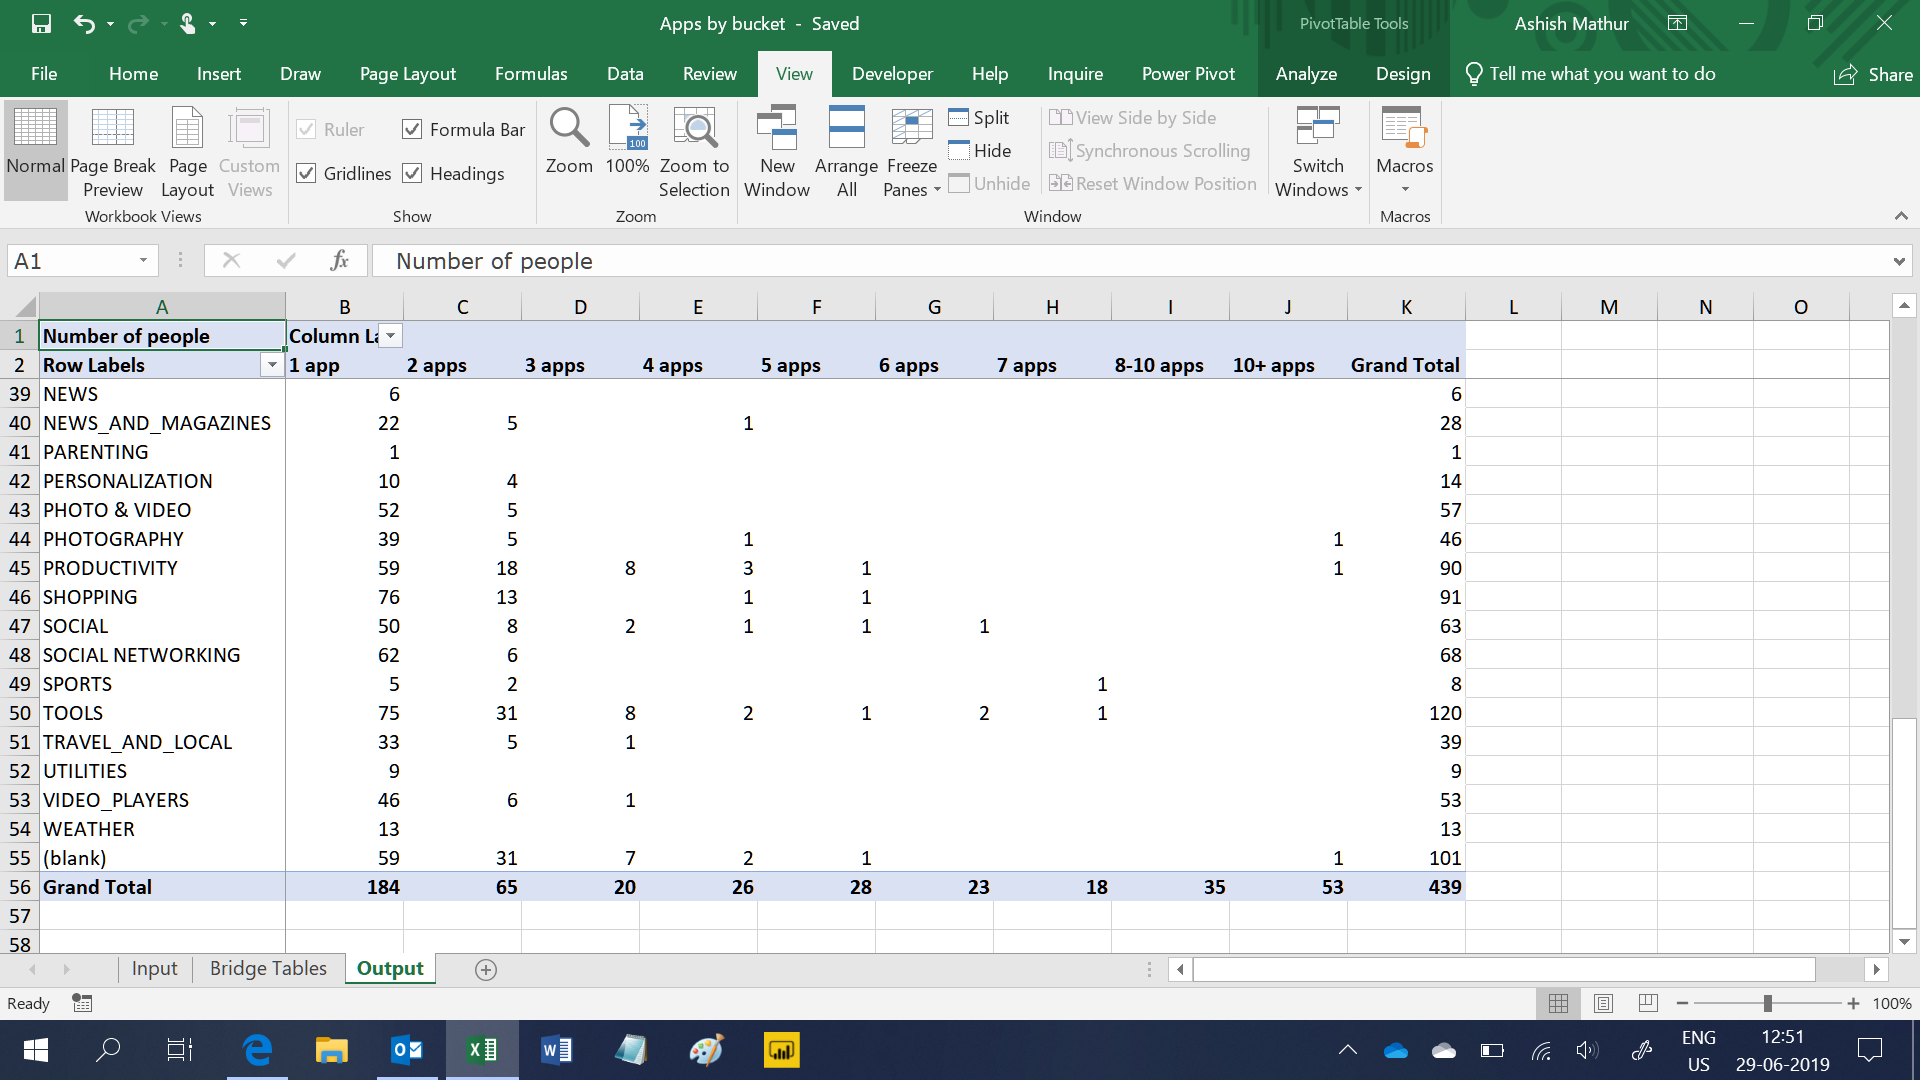
Here’s how one can interpret the Pivot Table shown above:
- Cell B50 – There are 75 people who only have 1 “Tool” app installed
- Cell J44 – There is just 1 person who has 10+ Photography apps installed.
I have solved this problem using Power Query and PowerPivot. Since these two Business Intelligence (BI) tools are available in PowerBI desktop (PBI) as well, you may download a folder with both files (the MS Excel workbook and PBI file) from here.
Segment customers into dynamic buckets
{ 0 Comments }